Tag Archives: Histogram

Ten great tips for photographing landscapes

Landscapes appear inherently attractive to the eye.

We all love taking landscape shots at some time or another. However, they are also quite a challenge. There are a few simple things that you can do to get a great landscape shot.

Use a tripod!

The most important landscape photography technique is to use a tripod. For your shot to be successful you need to get the sharpest and most carefully framed shot.

  • Framing: When you put up your tripod you give yourself the best opportunity to get the framing right because you can take your time. Look around the shot. check the edge of your frame. Make sure you have all the right composition elements and have a meaningful subject in your viewfinder.
    See more on framing here.
  • Stability: The tripod will give you the most stable platform for your shot. Most photographers miss this essential when starting out. Sharpness makes or breaks a landscape shot. Starter landscapers often think a hand held stance is good enough. It may be possible – sometimes. The chances are reduced. If you want to get right into the shot you must get pin sharpness.
    See more on why you should use a tripod here.
Vibration elimination

Beating the movement blur of the hand-held shot needs more than just a tripod. Your tripod technique is critical too. The most important part of using a tripod is to reduce the vibrations through it. Here are my ten tips for making your tripod-based landscape shot pin sharp.

  • Tip 1: Keep the legs as short as possible and don’t use the middle elevating column. The short legs and no-column policy keeps the tripod tight and that reduces any integral vibration in the tripod itself. The vibration is reduced because the tripod is stiffer overall if the legs are retracted. If you must elevate it, make sure you extend the thinner, vibration prone, bottom of the tripod legs last.
  • Tip 2: Use a cable release: Pushing the release button (shutter button) moves the camera and creates vibration in the tripod. A cable release of some type will set the camera off without your heavy finger involved.
  • Tip 3: Use mirror lock-up: Most DSLRs will have a menu setting that will lift the reflex mirror before the shot is fired. The number one source of vibration in a camera is that mirror twanging up and down! The mirror lock-up function will remove this vibration. Check the manual to see how it is done on your camera.
  • Tip 4: Turn off auto-focus: The engine and the act of the camera tuning its focus causes vibrations in the tripod. These set up a resonance up and down the legs – the vibration affects your shot. You will produce a much more accurate focus by hand anyway.
  • Tip 5: Turn off image-stabilisation: If you are on a tripod you don’t need it. However, the slightest breeze or vibration through the ground will set it off. The motor attempting to compensate for tiny vibrations in the tripod will in fact create more vibrations. All image stabilisation systems are designed to iron out natural hand movement. Vibration in a tripod creates its own peculiar vibration which just aggravates the stabilisation system.
  • Tip 6: Hang a weight on the tripod hook under the centre column: This weight adds tension to the legs and forces greater stability to the tripod. One more way to reduce movement.
  • Tip 7: Stay away from vibration sources: Its not always possible, but roads, railways, fairgrounds, airports, ferry terminals and ports as well as the obvious wind all create ground vibrations. Less obvious are underground trains and tunnels under your feet, tall buildings swaying in high wind, bridges vibrating from feet and vehicles… well it’s a long list. Think carefully. You may find you have put your tripod right in the centre of a major vibration source.
  • Tip 8:Remove your camera strap: or as a secondary measure peg the strap tightly to the tripod. If you let it hang loose it will catch the wind. That will move or vibrate the camera.
  • Tip 9: Longer exposures: The camera shutter is also a significant source of vibration. Nevertheless, it has to open. Using a longer exposure is better because the shutter is open completely with no movement for at least part of the shot. This reduces the impact of shutter shake. The shutter release and movement still creates a vibration profile. By design, it has been carefully calculated to reduce the impact of the shutter movement – but it does not reduce shutter vibration completely. So, longer exposures help reduce the vibration just a little more.
  • Tip 10: Use a wind-shield: Even a light wind will induce vibration in a tripod. So, shelter it from the wind. Hold your coat in front of the tripod (not touching it) to shield the wind. Better still, if you are going to be there for a while, put up a staked-out wind-shield to divert the wind properly. Alternatively, take the shot from cover of some sort.

Remember, these measures all add up. Sharpness in your shot is the result of working at all of these. Put all of the above in place and you will get a really sharp shot.

More you can do…

Here is a list of some more top tips to work on for your landscapes…

By Damon Guy (author and Photokonnexion editor)

Damon Guy - Netkonnexion

Damon Guy (Netkonnexion)

Damon is a writer-photog and editor of this site. He has run some major websites, a computing department and a digital image library. He started out as a trained teacher and now runs training for digital photographers.
See also: Editors ‘Bio’.

Can you write? Of course you can!
Write for Photokonnexion...

We would love to have your articles or tips posted on our site.
Find out more…
Write for Photokonnexion.

Can You Use the Histogram on Your camera?

Histogram functions showing on the screen of a Canon 5D MkII

Histogram functions showing on the screen of a Canon 5D MkII
The white (lower) graph shows brightness trends. The colour graphs show the tonal brightnesses for each colour.

Modern DSLRs have a ‘Histogram’ function. It is sometimes hidden in the menu items, but it is there in up to date cameras. The idea of the histogram is to provide a simple analysis of the brightness of your shot. This article will show you how to use your histogram to improve your photography.

Find the Histogram Function

You will find that most histograms have two settings. They are ‘brightness’ and ‘Colour channels’. In most cases the brightness is the useful setting. It gives you the best indication of the exposure effectiveness. However, if you are particularly interested in colour distribution in your image use the colour histogram. This indicates brightness for each of the three colour channels.

The histogram function is usually found in the menu settings. Setting it up usually just requires enabling that function. However, on some cameras you may need to make a change to the display setting as well once you come out of the menu. For detailed instructions on enabling and settings refer to your camera manual.

What is the Histogram?

It is a graph. When you take a picture your camera calculates how bright your shot has come out. The camera presents the histogram as a line with thin upright bars on it. The bars are next to each other and together make a shape of solid white on the graph.

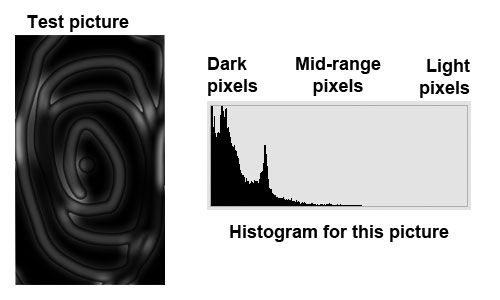
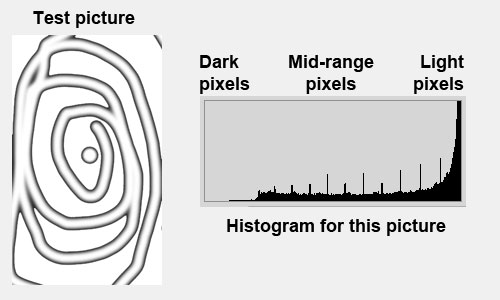
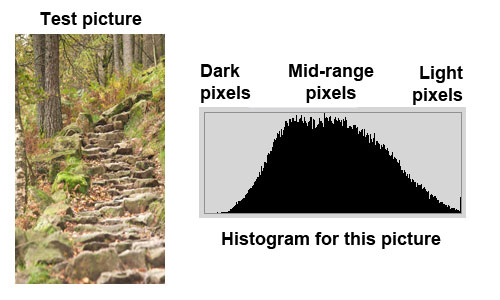
Each upright bar represents the number of pixels of that particular brightness. Across the horizontal width of the graph the spread of bars shows how brightness is distributed. The left side of the histogram is the shadow side – indicating the extent of the shadowed/dark pixels in the shot. The right side is the highlight side – indicating the extent of the brightness of pixels in the photograph. In the middle area of the graph there lies the mid-tones.

You read the graph by understanding the trend of the curve created by the bars. More of the bars on the left side tells you there are more dark pixels – the shot may be under-exposed. More bars on the right side indicates the picture will be bright. The further right the greater the brightness.

If the graphs leans up against one side or the other this indicates that some of the pixels are either completely black (left side) or completely white (right side). Where this occurs there is usually lost detail which you can not recover. If a high proportion of the pixels are on one side the picture will be under-exposed (right side) or over-exposed (left side).

Picture showing a dark overall spread of pixels

Picture showing a dark overall spread of pixels. The trend of the pixels is to the left - when they are up against the edge of the graph there is some lost detail in blacks.

A peak on the right side indicates more bright pixels in the picture. The shot is bright if the picture is more to the right. If it is leaning against the right hand margin of the graph there is lost detail in the whites. This indicates the picture may be over exposed…
A right hand side trend indicates a bright picture overall.

A right hand side trend indicates a bright picture overall. A histogram up against the right hand side of the graph indicates lost detail in the whites.

In an ideal exposure you will find an evenly shaped peak in the middle showing a good distribution of light and dark across the shot. Detail will not be lost if there is no contact with either side of the graph edges. The histogram will show a good distribution evenly across the centre of the graph for a good exposure.
An even distribution of the bars in the middle of the histogram indicates a good exposure in the mid-range of brightness.

An even distribution of the bars in the middle of the histogram indicates a good exposure in the mid-range of brightness. No detail is lost in the extremes of whites or blacks if no histogram bars are up against the right or left hand side of the graph.

Variations from the ideal

The distribution of brightness on the histogram is only an indication of the success of your exposure. Pictures with a white background, like some portraits for example, will show a bright, right-side histogram. You may accept that because you intended the background brightness – as long as your portrait subject is well exposed in front of the white. The camera is merely reporting the data it has collected. It up to you to decide if the shot you got is correct. The histogram reports the status of the brightness and you can ignore it or decide to shoot again. That is the beauty of the histogram – it helps you decide if you have got it right or not. It it is particularly useful to identify if there are any lost details in the extremes of the light range (the blacks or whites).

The colour channel histograms

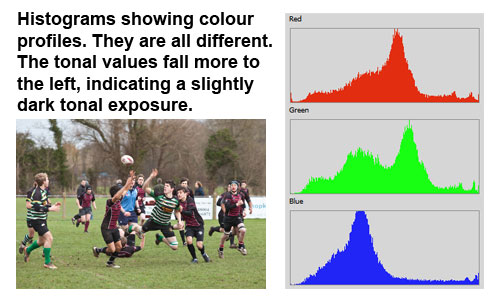
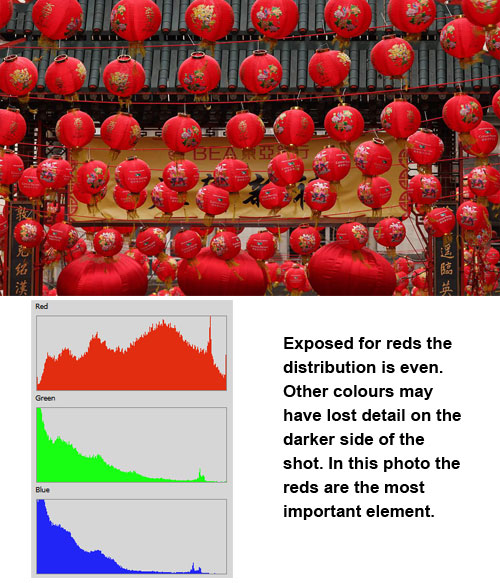
The colour graphs show tonal variations on three colour channels, red, green and blue. The shape of each colour graph shows tonal brightness from dark tones (left) to brighter tones (right). The shape of the graph indicates the brightness and detail clipping in the same way as the brightness histogram.

A tonal distribution which is a little on the dark side of the histogram.

A tonal distribution which is a little on the dark side of the histogram. A good exposure in rather poor light. The different colour profiles provide an indication of the colour variation across the tonal range. The shape of the colour histograms indicates the same outcomes as for the brightness.

Shows histogram distribution to support a dominantly red photograph.

Shows histogram distribution to support a dominantly red photograph.

By Damon Guy (author and Photokonnexion editor)

Damon Guy - Netkonnexion

Damon Guy (Netkonnexion)

Damon is a writer-photog and editor of this site. He has run some major websites, a computing department and a digital image library. He started out as a trained teacher and now runs training for digital photographers.
See also: Editors ‘Bio’.

Can you write? Of course you can!
Write for Photokonnexion...

We would love to have your articles or tips posted on our site.
Find out more…
Write for Photokonnexion.